Database relations and graph visualization
It often happens that a project grows and grows until a point where it would be desirable to split it in multiple subprojects. This would lead to small, independent, more maintainable components and it would be easier to work in parallel on the subprojects.
Still, it is not always easy to understand how to split a big project (a big ball of mud?) into meaningful independent subprojects.
The first step to achieve such a goal is to inspect our system and analyze the relations between its components. If a component is loosely coupled with the rest of the application, it becomes a nice candidate to become an independent service on its own.
But how can we visualize and analyze the relations between all the components of our project? If we are using a relational database for data persistance, we already have a place where we could look for these relations.
Database relations
In a relational database we can see foreign keys between tables as relations. For example, if we have a trip table that has a foreign key to a customer table and a foreign key to a car table, we could easily infer that our concept of trip depends on the customer and car concepts.
In other words we could visualize our database as a directed graph, where the vertices are the tables of the database and there is an edge going from table A to table B if there is a foreign key in A referencing the table B.
To obtain the data necessary to generate this graph, we could use the following query (in PostgreSQL)
SELECT
    tc.table_name,
    ccu.table_name AS foreign_table_name
FROM
    information_schema.table_constraints AS tc
JOIN information_schema.constraint_column_usage AS ccu
    ON ccu.constraint_name = tc.constraint_name
WHERE constraint_type = 'FOREIGN KEY'
GROUP BY tc.table_name, foreign_table_name;
This will produce a list of pairs of table names, where each pair represents an edge from the first table to the second table.
Visualize the graph
Once we have the query data exported (maybe as a .csv file) we could import them in graph analysis tool, like Gephi. Once we have done that we would obtain something like the following graph
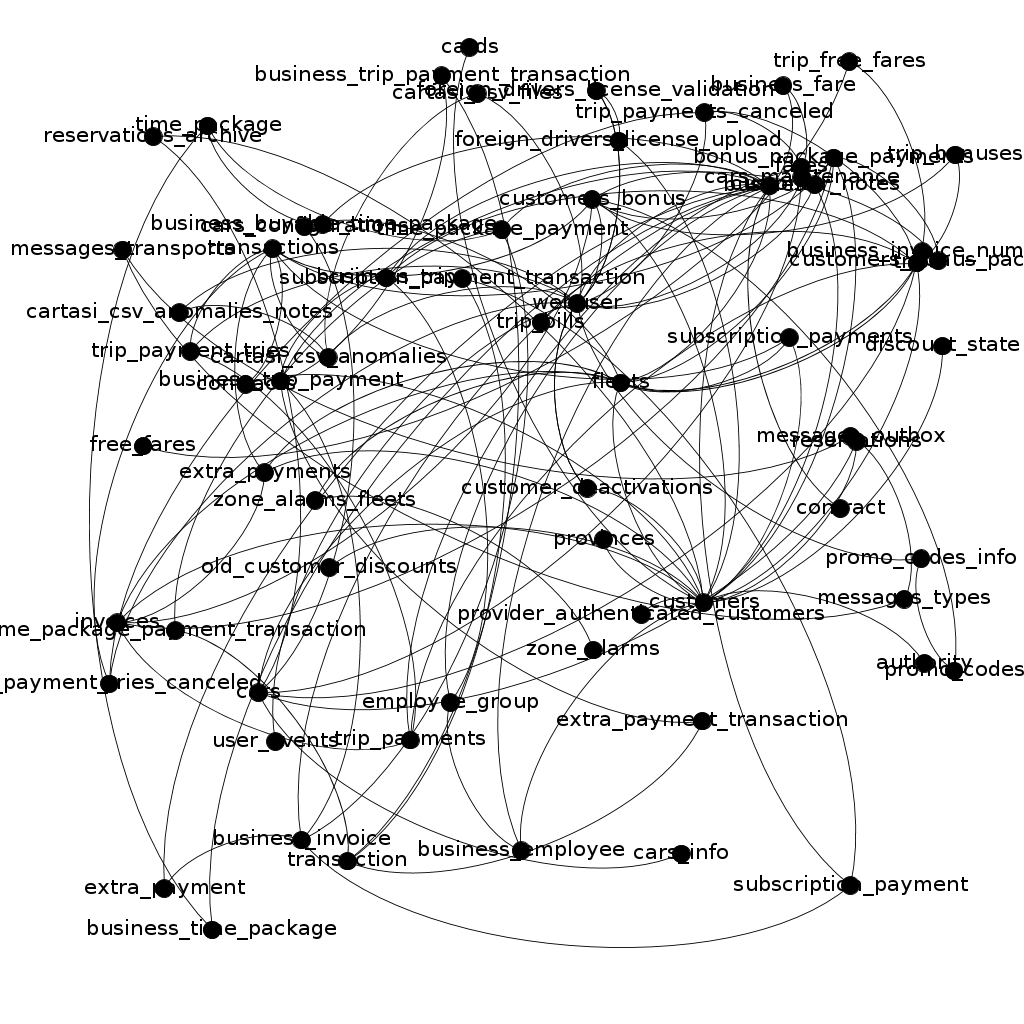
Not really useful as it is, isn’t it?
To obtain something more readable, we need to use Gephi’s functionalities. For example, I used Force Atlas, Expansion and Label Adjust layout helpers to modify my graph and obtain this
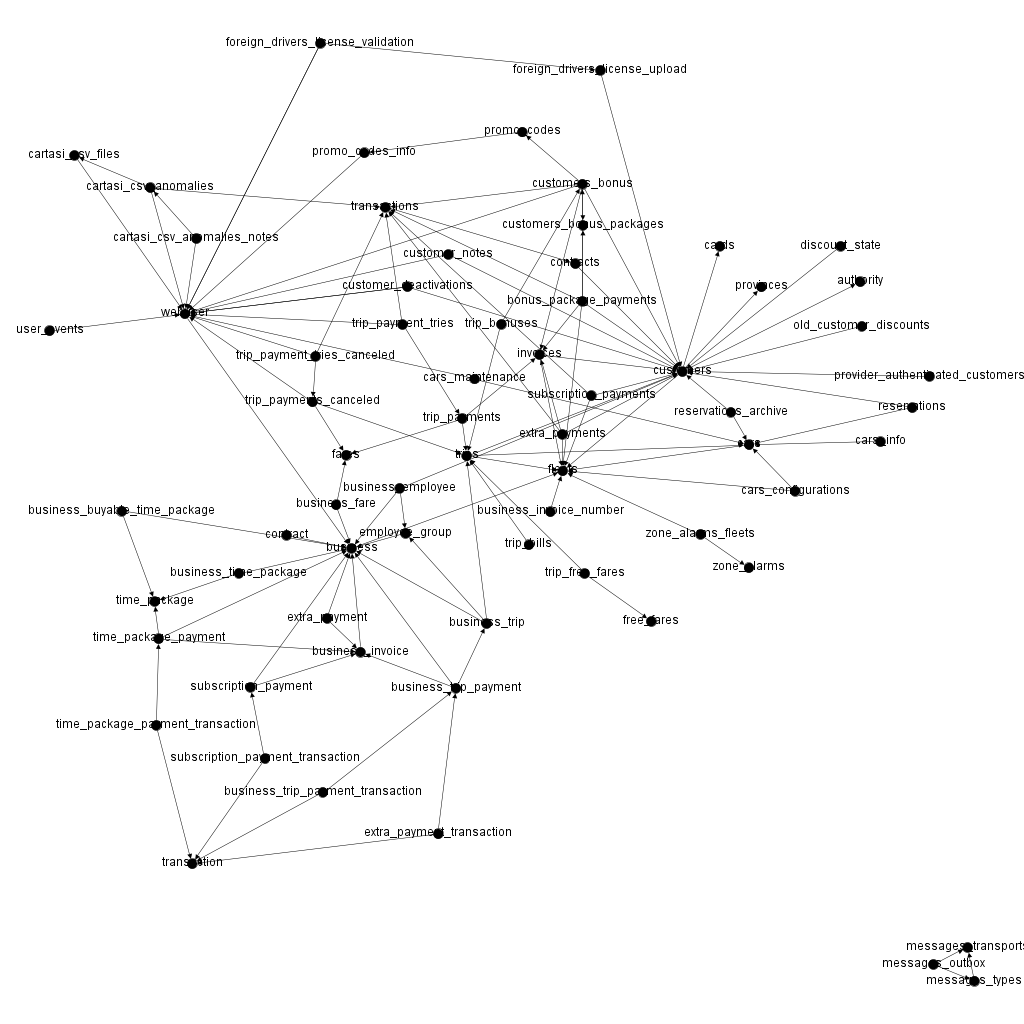
Now it is already much better than before, and we can right away observe that in the lower right we have three tables completely unrelated to all the rest of the application. That is probably something that would be easily separated from the rest of the system creating an external component.
Anyhow, before jumping to other conclusions, we could still improve our graph so it could represent better our model of the domain. To do this we must proceed manually, because knowledge of the domain is required.
For example we could remove from the graph the tables that are not really representing domain entities. In our case the webuser table is linked to many other table because, for some operations, we store who was the author of that action. This creates only noise in the representation of the domain, so, we better remove that table.
Another thing we could do to clean the graph is remove some edges that are not representing real relations at the domain level. For example, we have an arrow going from the trips table to the fleets table, meaning that, for every trips we store the fleet of the car used to do that trip. This edge is superfluous, because we already have a relation between the trip and the car and between the car and the fleet. In this way we could remove some other edges that are no relevant to our analysis and arrive to something like the following
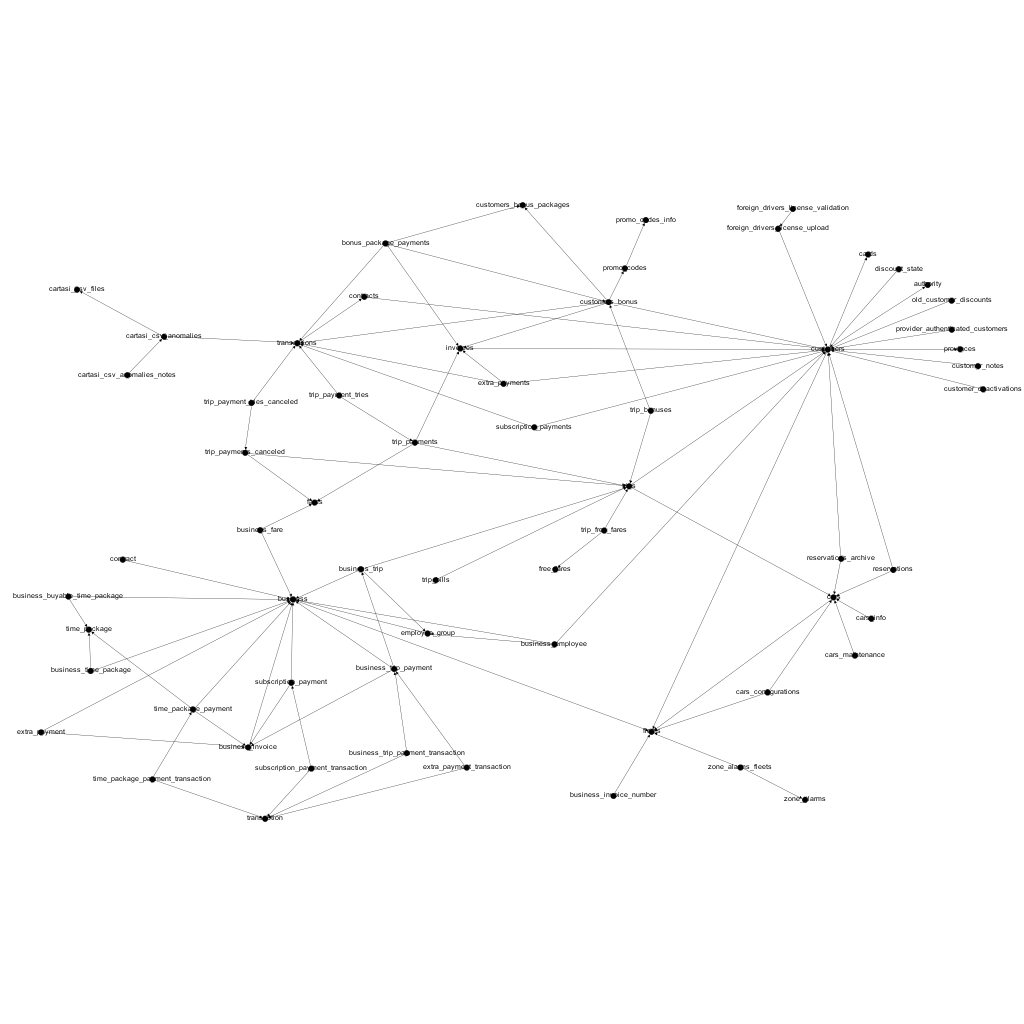
From this graph we could observe some groups of related tables, which indicate the possible existence of components that could be isolated in separate subprojects. On the other hand, it often indicates how the various components are linked together quite tightly, suggesting that it will be hard work splitting them in separate projects.
Conclusions
Analyzing the graph given by the relations of the tables in a relational database could be helpful when trying to split a project in multiple components, revealing also how these components are connected. Such a graph could reveal some insights that are present in the used model of the domain and suggest how to treat them correctly.
Anyhow, this is a clearly data-driven approach and many details could be lost focusing only on the structure of the database. The graph should be only a starting point for the analysis and for creating a rough representation of the current model of the domain.
To go further on with the analysis it is certainly needed to have other sources of understanding of the domain. Sure thing, our experience and the one of domain experts will be essential to complete the analysis successfully.